
Last Updated on

Google Analytics is a powerful tool but is completely useless if you don’t know how to use it.
If you properly use Google Analytics, you’ll be able to formulate a strategy to help drive more traffic to your blog or website. This is going to be a beginner’s guide to Google Analytics, so if you feel overwhelmed when you enter your analytics dashboard, you are in the right place!
Today, we will go through all the basics so you are able to understand your analytic information.
How to Set Up Google Analytics
First things first. You are going to need to set up Google Analytics for your website.
If you don’t yet have Google Analytics installed, here is an easy to follow tutorial on how to set up Google Analytics.
The Google Analytics Dashboard
When you first enter Google Analytics, you will be greeted with a dashboard that looks like this:
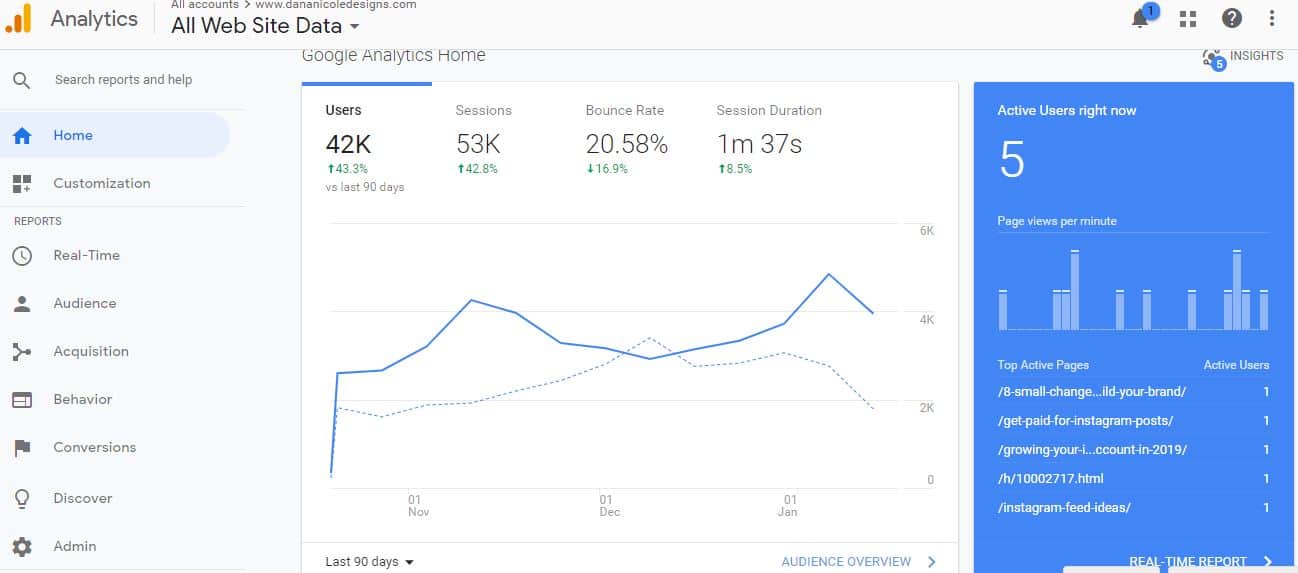
Along the left-hand side there is a sidebar that can take you to different reports. In the center, you will be able to see an overview of your traffic including:
- bounce rate
- sessions
- session duration
- users
You can also toggle the amount of days you’d like to view the data for. See on the image where it says “Last 90 days”? (Located at the bottom of the report).
You can change this to whatever time frame you’d like!
To the right of that, you can see in real-time what pages have active users on them. But let’s talk about the four areas above and what each of them means.
Bounce Rate
The bounce rate is expressed as a percentage and it is the percentage of people who leave after visiting one page on your website.
For example, if your bounce rate is 80%, that means 80% of the people who come to your website, don’t click around or check out anything else other than the content they landed on.
How This Stat Can Help Your Blog: A high bounce rate can indicate a few different things.
First, it can mean your content doesn’t appeal to your audience.
Think about it: if you land on a website that has killer content, what do you do? You likely click around.
On the other hand, if you end up somewhere where you don’t love the content, you’ll likely to click out.
This could be because you either found the content to be of poor quality, or because you just didn’t find any other blog posts that fed into your interests.
Bloggers who blog about a wide variety of topics (i.e. someone who blogs about makeup, travel, food and life all on their blog) might have higher bounce rates.
Let’s put it this way. If I come to your blog because you posted a recipe about hummus, I’m likely not going to click around if all the other blog posts I see are on various topics such as lipstick, or hair care or your recent trip to Athens.
However, if I see you have another blog post on healthy dips, I would likely click onto that.
Make sense?
I’m not saying it’s a bad thing to write on different interests (but I am a fan of niching down), but knowing this can help you understand why your bounce rate may be lower.
Secondly, your article could be so good that the user has no reason to click around.
If you’ve done an amazing job explaining something or answering a question, and you’ve gone above and beyond, why would your reader need to click around?
Many argue that your bounce rate isn’t the strongest indicator of quality of your content for this very reason.
However, I still like to keep track of my bounce rate and see if I notice any trends.
For example, one day I noticed that my bounce rate skyrocketed.
Why would people all of a sudden be leaving my website after landing on one page?
After doing a bit of investigating, I found the my website had some error that wasn’t allowing my content to be seen (so nobody was clicking around)!
I quickly contacted my host Siteground* to fix the problem. My site was fixed by them right away (because they are the best hosting company out there!) and my bounce rate went back to normal.
Session
A session is the total number of visitors to your site, both new and returning.
If I go to your website and click on thirty different pages, that counts as ONE session (not thirty).
But (and I’m getting ahead of myself here) that counts as 30 pageviews (we will talk about that later).
Sessions expire within 30 minutes. So let’s say I visit your blog and click around. That’s one session.
Now let’s say an hour later I decide I want to read more on your blog!
That counts as another session since my 30 minute window has expired.
How This Stat Can Help Your Blog: Sessions are a great way to see how many different people are going to your blog.
Users
A user is a person who has visited your website for the first time. Here’s how it works:
When someone visits your website, they are assigned a “cookie” which then track them for up to two years. And by tracking, I just mean that if they return to your website a month later, Google knows they’ve already been on your website. The cookie doesn’t actually track them or see where they go afterwards.
Here’s an example.
I visit your website for the first time on January 1, 2019. Google assigns me a cookie and counts me as a “user” in your analytics.
On January 15, I come back to your website. Because I’ve already been on your site before, Google recognizes that and doesn’t count me as a user. So on January 1, your analytics report would show at least one user (me!), but on January 15, it wouldn’t show me again.
How This Stat Can Help Your Blog: This metric can be helpful in a few different ways.
First, you are able to see the growth of your blog. Take a look at the users of my blog for the last year and a half:
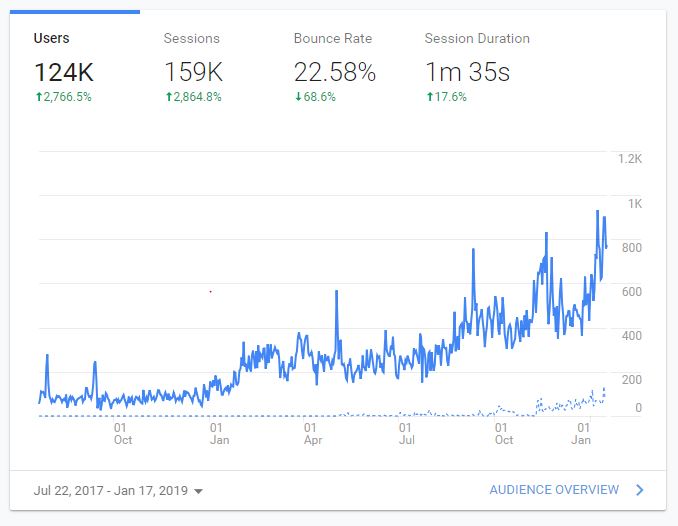
The dates are set from July 22, 2017 to January 17, 2019 (I know, weird time frame but it helps me illustrate my purpose!).
As you can see, over the last year and a half I have gained a lot of new users. I attribute this to the fact that my blog is starting to gain speed, my SEO strategy is starting to pull in lots of passive traffic, and I’ve been working to get my content seen by the right people!
This can help you understand if your marketing strategy is helping. If you are getting lots of traffic but you have a really low number of users, then your marketing strategy might not be working as it’s not bringing in new people to your site (unless your strategy is to only target exsisting readers).
One thing about your users: if someone clears their cookies and they go to visit your website, they are counted as a new user again. If they visit your website from multiple devices, each device is considered a new user i.e. if I visit your blog on my laptop, I’m counted as a new user. If I go an visit it two days later on my iPhone, I’m counted as a new user!
Also, the cookie resets after two years. So if I visit your website on January 1, 2019 (aka my cookie expires on January 1, 2021) and then I don’t visit it again until January 1, 2023, I’m considered a new user.
Alternatively (yes, I know there is a lot!), if I visit your website on January 1, 2019 (meaning my cookie is set to expire on January 1, 2021) and I visit it AGAIN on January 5, 2019, the cookies expiration date is now set to January 5, 2021.
Fewf. You still with me? Moving right along!
Session Duration
Session duration is pretty self-explanatory. If you remember what a session is (someone who visits your website, either new or returning, and within a 30 minute time frame) then session duration is just the average duration of said session.
But there’s more to it than that…
Here’s why I don’t like session duration, and in order for me to tell you, I need to explain how Google measures session durations in a little more detail.
Google uses your bounce rate to help calculate the session duration.
Here’s how:
If someone visits a page on your website (let’s call it page A), Google assigns them a timestamp of 00:00 and begins to time them.
If they click onto a new page (let’s call this one page B) on your website, Google will assign them another time stamp.
If they were on page A for one minute before clicking to page B, Google would assign them a time stamp of 01:00.
Now, Google is able to subtract the first timestamp (00:00) with the second timestamp (01:00) to determine that your visitor has so far spent one minute on your page.
Easy!
Now if they spend 30 seconds on page B and then click onto page C, Google assigns them another time stamp which helps them calculate how long they spent on page B.
But what if your visitor lands on page A (their first page) and then doesn’t click around? A.k.a, their bounce rate is 100% meaning they didn’t click on any of your other content.
Well, Google was able to assign them a timestamp of 00:00, but wasn’t able to assign them a second one because they didn’t click on a second page.
Meaning in your analytics, Google is going to assign them a session duration of 0 minutes and 0 seconds.
Even if they spent 3 hours on your blog post reading everything over and over, they will still get a session duration of 0 if they didn’t click onto another page.
If your bounce rate is higher, your session duration is likely going to be heavily skewed.
What To Do Instead: I prefer to look at the metric “Average Time on Page”.
Here’s how you can access it!
First, on the left hand side of your dashboard, find “Behaviour” and click on “Overview”.
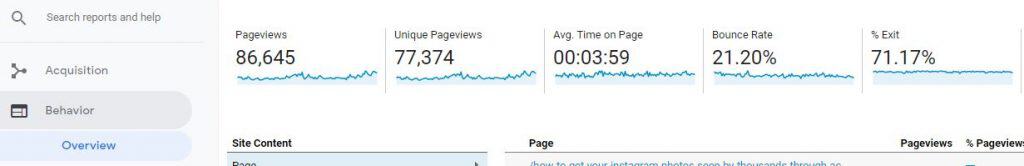
By doing this, you will see the average time on page which doesn’t take into account those 00:00 sessions from people who were assigned a bounce rate of 100%.
This metric doesn’t provide the full picture, since it’s not including a lot of your audience (anyone who bounced after one page) but if you compare both average time on page and session duration, you will be able to get a rough idea of how long your audience is spending on your website!
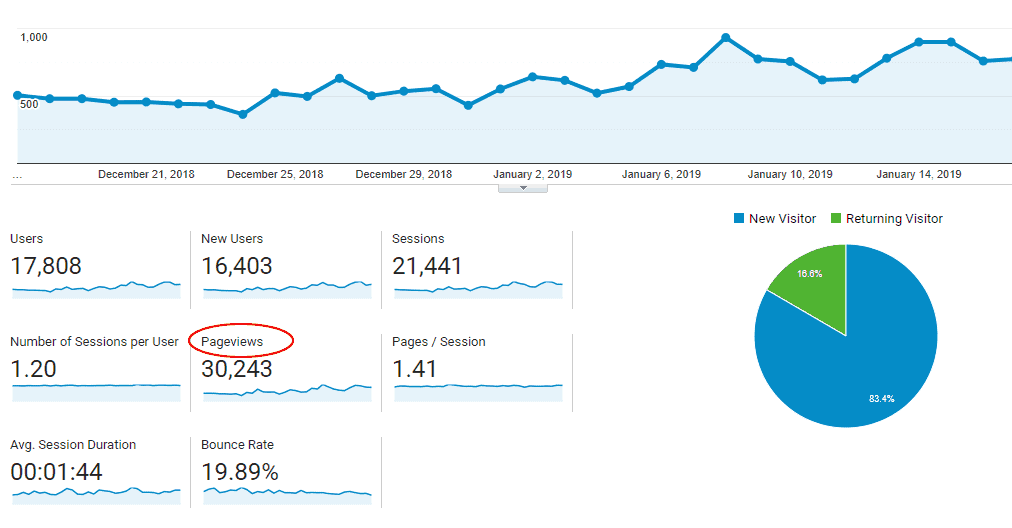
Pageviews
Google doesn’t show your pageviews on the home page. A pageview is another self-explanatory term. If I visit four pages on your website, that counts as four pageviews.
To check out your pageviews, click on “Audience Overview”.
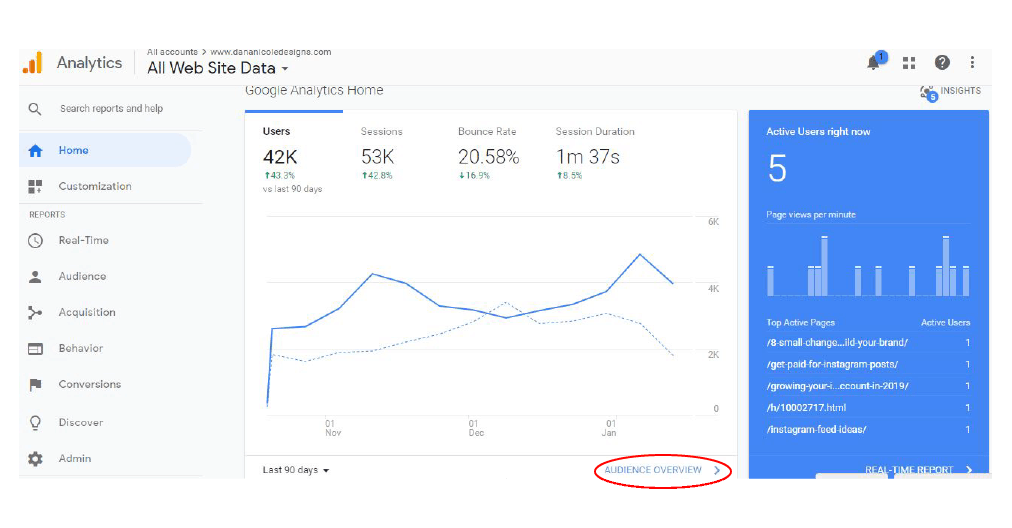
After clicking on that, you’ll be brought to a page with an overview of your analytics and you can see your total pageviews.
Advanced Google Analytics
Now that you understand the basics, I’m going to show you different reports that can help you understand your blog.
First, on the left-hand side, click on “Acquisition” and then “Overview” which will bring you to the below page. From there, click on “Social”.
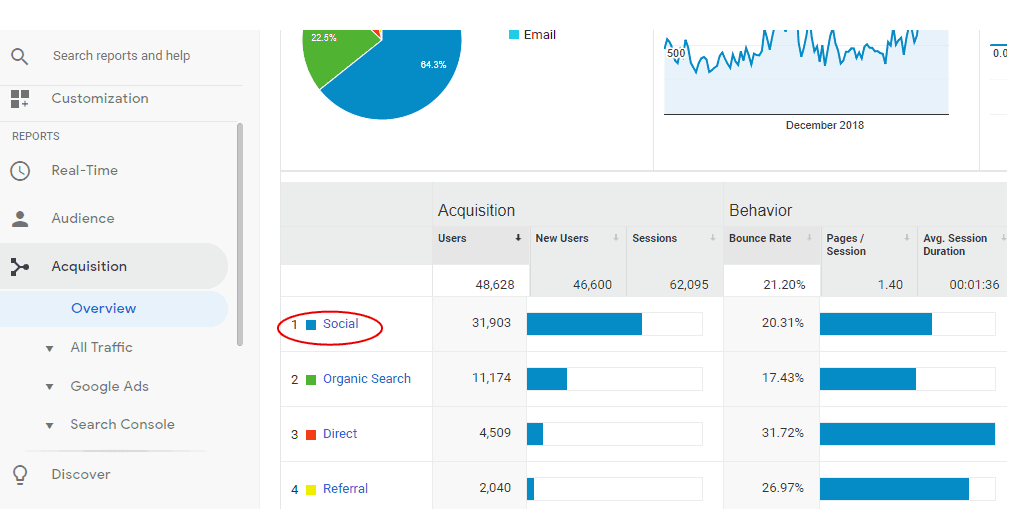
Here, a report will bring up all the different traffic you are receiving to your website from your social channels.
This can help you understand where to put your efforts. If you notice that Instagram is sending you lots of traffic, it would be a good idea to continue to bolster your Instagram following!
We can also take a look at which social channels send us engaged traffic by looking at the below metrics:
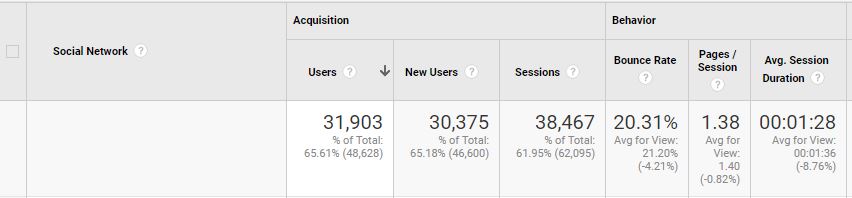
It’s very interesting to see how the metrics vary across each platform (not to mention helpful!).
If you are spending a lot of time promoting your content on Facebook, but you notice that your audience from Facebook has an incredibly high bounce rate, you’ll know that the traffic coming from Facebook likely isn’t high quality.
Another report I love to look at is the pages that bring me in the most traffic so I know what content my audience wants to see more of.
If you head back to your home page and scroll down a little bit, you’ll see something that says: “What pages do your users visit?”.
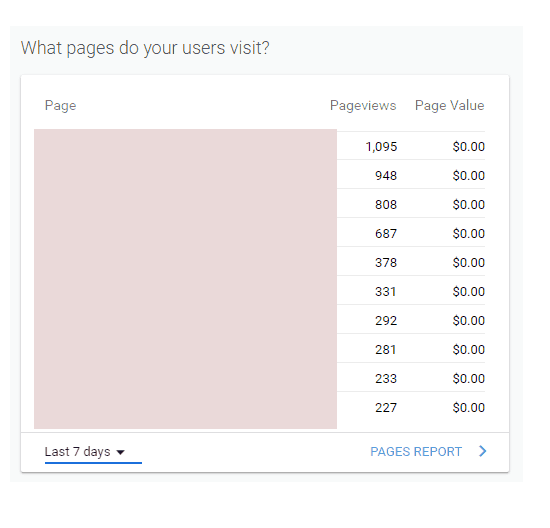
The above report is set to the last seven days, but you can change it to anything you wish. Seeing trends can help you identify what content you should be creating more of!
Alternatively, I’ve used this to help me develop products, write affiliate content and increase the income my blog makes because I know what my audience is interested in.
For example, if you write a pet blog and you notice that anything dog-related does incredibly well, would you invest your resources in creating cat toys? Probably not, since it seems that your audience is more interested in dogs.
In Conclusion
A lot was covered in this begginner’s guide to Google Analytics but I hope this helps you understand your analytics a bit better!
You can do amazing things with your content once you dig deep into your analytics.
If you’re still feeling flustered, I offer blog coaching where I can write up suggestions and a report to help you understand your analytics!
This blog post contains affiliate links. For more information on affiliate links please review my Terms and Conditions
This article may include affiliate links. As an Amazon Associate I earn from qualifying purchases.

Dana Nicole is an award-winning freelance writer for MarTech/SaaS who was rated one of the best SaaS writers by Software World. She specializes in writing engaging content that ranks high in search engines and has been featured in publications like Semrush, ConvertKit, and Hotjar.
Dana holds a Bachelor’s degree in Business Administration and has over 15 years of experience working alongside national brands in their marketing departments.
When Dana’s not working, you can find her dancing en pointe, cooking up new recipes, and exploring the great outdoors with her two big dogs.